

Current market sentiment and volatility may discourage investors from remaining in the stock market. However, these challenging conditions also offer opportunities for investors to identify trade ideas that can lead to outperformance, even when the broader market and most investors are struggling.
In this research article, we will explore which quality and value stocks may be best suited for these times, how to find them, and provide guidance on how to navigate the current market landscape. We will utilize Trading Central’s Fundamental Insight, Strategy Builder, and Nowcasting tools to uncover and extract valuable trade ideas and insights for investors to consider for their portfolios.
According to Trading Central’s Nowcasting tool, the U.S. economy has experienced a slowdown phase for the past 26 days. This period is marked by moderate growth, tightening credit conditions, pressured earnings, increasing inventory, slowing sales, and contractionary policies. During similar instances in the past, equities in the Materials (XLB), Energy (XLE), and Communication Services (XLC) sectors have performed well. Additionally, small-cap and value stocks have demonstrated resilience in this environment. Conversely, equities in the Consumer Staples (XLP), Healthcare (XLV), and Consumer Discretionary (XLY) sectors, along with mid-cap and growth stocks, have struggled during this time.

Let's incorporate these insights into Strategy Builder to develop a screener for high-quality and value stocks. We will begin by refining our search to include only U.S. stocks with a market capitalization between $300 million and $2 billion, focusing on small-cap companies. Additionally, we will filter for share prices above $10 to ensure stability and liquidity. In line with Nowcasting's recommendations, we will concentrate on companies within the Materials, Energy, and Communication Services sectors. Finally, we will integrate Fundamental Insight to our screener, restricting the stock universe to those with TC Quality and TC Value Factor Ratings of 55 or higher, which are deemed "Good" according to Trading Central's fundamental criteria.
Our screening process yielded the following stocks:

It's interesting to highlight that over the past five years, the S&P 500 recorded a total return of 82%, resulting in an annualized return of 13%. In comparison, our screener outperformed with a five-year return of 109% and an annualized return of 16%.
Let's take a closer look at some of these companies to determine what distinguishes them as strong quality and value stocks. To do this, we will utilize Trading Central's robust Fundamental Insight tool.
STNG: NYSE
Scorpio Tankers boasts the highest Value rating on our list at 85, indicating exceptionally strong value. The company displays favorable ratios and valuation metrics when compared to its industry peers, featuring a robust earnings yield of 33% and an impressive price-to-book ratio of 0.69.
Additionally, its TC Quality rating of 77 suggests that both its balance sheet and earnings quality are very strong. Scorpio Tankers' profitability ratios, leverage ratios, and operating margins outperform those of its competitors. The company reports an operating margin of 37.97%, a total debt-to-equity ratio change of -0.40, and a year-over-year Return on Equity change of +1.38%.
Below we can see how the Value and Quality ratings have changed in the past and its latest trend. We can see that for both Factors the trend has been generally upward:

Other noteworthy data for investors includes a Return on Equity (ROE) of 24.68% and a dividend yield of 4.52%.
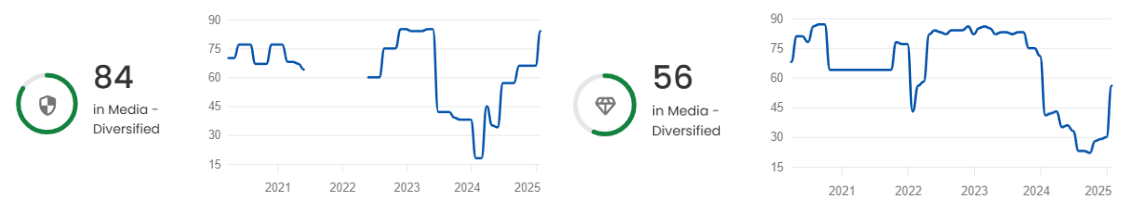
SBGI: NASDAQ
Sinclair demonstrates a strong Quality rating of 84, highlighting its superior profitability ratios, leverage ratios, and operating margins compared to industry peers. The company has achieved a remarkable year-over-year increase of 108.53% in its Return on Equity (ROE), while its Return on Invested Capital (ROIC) has grown by 10.81%.
On the Value front, Sinclair holds a solid rating of 56, indicating it offers strong value relative to its competitors. The company currently enjoys an earnings yield of 32.30% and an EV/EBITDA ratio of 4.79. The somewhat lower rating in this area may be due to its price-to-book ratio of 1.66 and a price-to-free cash flow ratio of 68.55. Investors are usually looking for low P/B and P/CF to identify undervalued companies.
As can be seen in the visuals below, the Quality rating has been on the rise after recovering from previous lows in 2024, while the Value rating had been on a downward trend until recently at the end of 2024, from which it has started to improve:
Other important metrics to consider for Sinclair include its P/E ratio of 2.83 over the past twelve months, an impressive EPS growth of 173.33% when comparing the last quarter to the same period last year, and a dividend yield of 7.53%.
While conducting thorough analysis and examining stocks is a crucial part of the investing process, investors must also pay attention to two other key components of trading and long-term success: the psychological aspects of trading and the importance of portfolio rebalancing.
As you delve into the insights and opportunities provided by Trading Central through Nowcasting, Strategy Builder, and Fundamental Insight, I highly recommend checking out the articles by my colleagues Philippe Delabarre and Théo Ramos. Their pieces, "The Psychology of Trading: Heuristics & Biases" and "Understanding Risk and Reward: How to Balance Your Portfolio" will enhance your trading toolkit as we navigate the volatile equity markets filled with uncertainty.


