

When markets tumble and fear grips the financial world, the instinct to "buy the dip" grows strong. After all, the lower the price, the better the bargain—right?
Not quite.
Trying to buy an asset in free fall is often likened to "catching a falling knife"—a dangerous maneuver that can lead to painful losses if mistimed.
Yet for seasoned traders and savvy investors, there are ways to reduce the risk and improve the odds of catching the market at or near a bottom.
The key? Technical analysis.
In this article, we'll explore how you can use proven tools to time a safer entry into a bear market—without losing a hand.
The goal: Not to catch the bottom perfectly, but to improve timing using technical analysis.
Bear markets are brutal—not just in terms of price, but also psychology. As prices drop, panic builds. Many traders try to jump in early, convinced they’ve found the bottom, only to watch prices sink further. To avoid being one of them, you must understand the emotional arc of a bear market:
Denial: "This is just a dip."
Panic: "Get me out!"
Capitulation: "I can’t take this anymore."
Despair: "I’ll never invest again."
True bottoms often form not in moments of hope, but in maximum pessimism. This is where technical indicators and Japanese candlesticks come into play.
RSI measures the momentum of price movements and helps identify overbought or oversold conditions.
In bear markets:
- An RSI below 30 indicates an asset may be oversold.
- In severe selloffs, watch for RSI below 20—this can signal extreme fear.
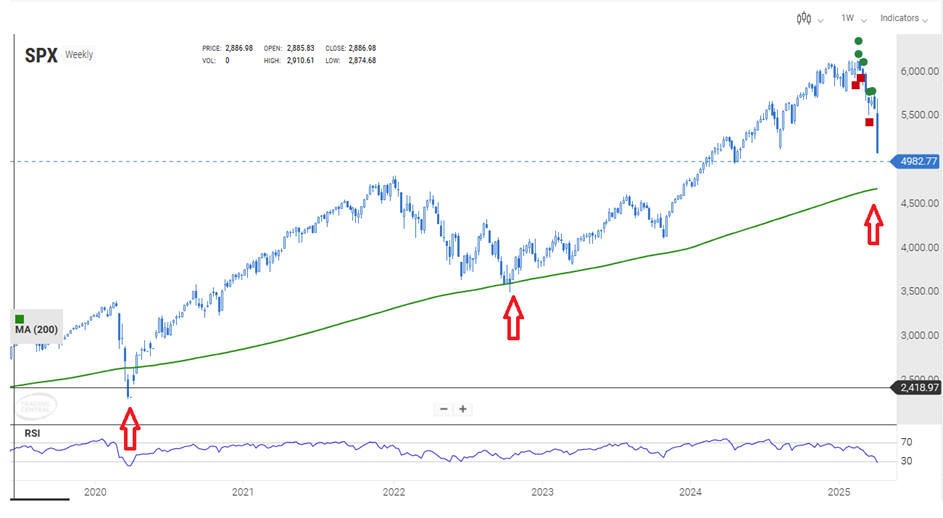
For example, the weekly RSI (14) on the S&P 500 hit a low in 2020 of 21.49% during the Covid crisis. Currently, the weekly RSI (14) is at 26.10%, and is therefore not extremely oversold.

The other method for detecting bullish reversal signals on the RSI (14) is to spot bullish divergence. (when price makes lower lows but RSI makes higher lows).
Moving averages smooth out price data and help identify trends.
Long-term moving averages are relevant for assessing whether a market's fall is excessive or not.
These moving averages can either support an asset's price or act as a restoring force that will encourage a price rebound.
The S&P 500 is currently close to its 200-week moving average, which halted the market slide in 2020 and 2022, but the moving average has not yet been tested and there is still room for further decline.
Volume often tells the truth when price action is deceptive.
Look for:
- Capitulation candles—long red candles on massive volume, often near bottoms.
- High-volume reversals—a bullish candle on strong volume can signal institutional buying.
Volume confirms conviction.
MACD tracks momentum and trend direction. To catch falling knives more safely:
- Look for bullish crossovers (MACD line crosses above signal line) from deeply negative levels.
- MACD is especially useful when combined with RSI or trendlines.
Back to 2020, MACD formed a bullish crossover in early April on the Nasdaq 100.

Bollinger Bands expand and contract based on volatility. When price breaks below the lower band, it suggests an oversold condition—but this alone isn’t enough.
Combine it with:
- Oversold RSI.
- Strong reversal candle (like a hammer, a bullish engulfing or a morning star pattern).
- Volume spike.
This trifecta can be a solid entry setup.
For example, the Nasdaq 100 and S&P 500 indices formed a bullish engulfing pattern in 2020 before the markets turned upwards.

Certain price patterns are more reliable than others in bear markets:
Double bottoms: The classic “W” shape. If the second low holds and RSI diverges, that’s a strong setup.
Inverse head & shoulders: A powerful reversal pattern, especially when accompanied by rising volume.
Falling wedge: A bullish pattern that often appears before a breakout. Look for a narrowing range with lower lows and lower highs, ending with an upside breakout.
Be wary of fakeouts—always wait for confirmation, such as a breakout and retest with volume.
Even the best technical setup can fail. That’s why risk management is non-negotiable:
Start small. Don’t go all-in on a speculative bottom.
Use stop-losses. Protect capital by cutting losses quickly.
Scale in. Add to positions as the trend confirms.
Only enter when multiple indicators align—don't rely on a single signal.
You don’t need to catch the exact bottom—you just need to be close enough to benefit from the upside. Those who waited in 2020 for confirmation reaped the gains without the stress of bottom guessing.
Catching a falling knife will never be safe—but with the right tools, it doesn't have to be reckless. By using a combination of technical indicators, watching for confirmation, and managing risk like a pro, you can improve your chances of entering bear markets when the odds are more in your favor.


