

Investing always involves a balance between risk and reward. While higher risks often come with the potential for higher returns, they can also lead to significant losses. Understanding different types of investment risks and employing portfolio diversification strategies can help mitigate these risks and optimize long-term financial success.

To make informed investment decisions, it’s crucial to understand the various risks that can impact a portfolio:
Risk profiling is a process that helps you identify the optimal level of risk that is just right for you as an investor, based on the following factors:
Diversification is the key strategy to manage investment risk while still capturing potential growth. By spreading investments across different asset classes, industries, and geographical regions, investors can reduce the impact of market fluctuations on their portfolios.
A well-balanced portfolio should include:
When building a diversified portfolio, it’s not enough to simply invest in multiple regions—you need to understand how those regions move in relation to each other. Correlation measures the degree to which asset prices move together:
A correlation close to 1 means assets tend to move in the same direction, like temperature and ice cream sales: as the temperature rises, ice cream sales tend to increase.
A correlation close to 0 means their movements are largely independent, such as with shoe size and intelligence or favorite color and music preference.
A negative correlation means they move in opposite directions, like the relationship between temperature and clothing layers, where one goes up as the other goes down.

A. Geographical diversification
By studying international equity correlation data, you can fine-tune your asset allocation in order to reduce portfolio volatility.

Example 1: U.S. vs Europe - High Correlation
3-year correlation: 0.88 (Morningstar US Market TR & Morningstar DM Europe xUK GR)
These two developed markets are closely linked economically and tend to respond similarly to global events.
Example 2: Europe vs. American emerging markets - Moderate diversification
3-year correlation: 0.60 (Morningstar DM Europe xUK GR & Morningstar EM Americas GR)
American emerging markets are more sensitive to commodity prices, currency volatility, and local political risk-factors less relevant to developed European economies.
B. Sector diversification
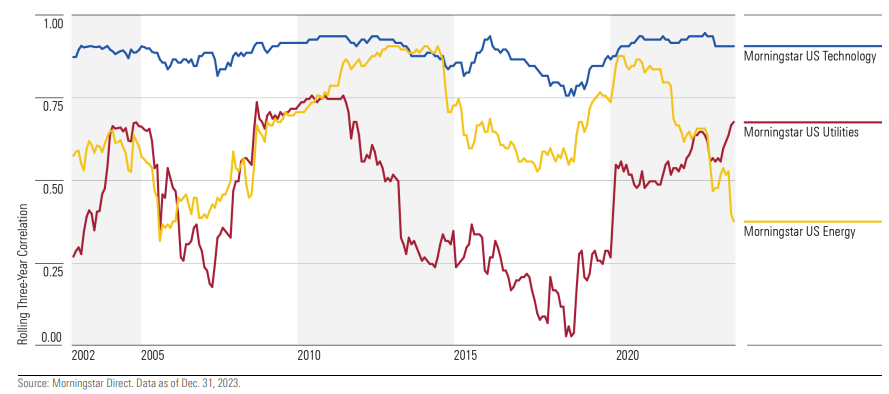
We saw a matrix correlation based on asset location, but you can also focus on matrix correlation based on equity sector:

Utilities and energy have been the sectors that have performed most differently from the broad U.S. market. In 2022 and again in 2023, energy stocks decoupled from the broad US market. The consumer defensive sector has also had a somewhat lower correlation with the US market than other sectors. Meanwhile, the technology sector's performance movements have been consistently correlated with those of the broad US market about 90% of the time.

C. The effect of global crises on stock market correlations
Another point to highlight is that the correlation between assets is not fixed. Correlations can change due to market conditions, economic events, or changes in monetary policy. For example, during the October 1987 stock market crash, correlations between the Canadian stock market and other markets surged. The correlation with the U.S. jumped from 0.54 pre-crisis (Aug 1987) to 0.91 during the crisis (Oct 1987), while the correlation with international markets rose from 0.10 to 0.60 over the same period. This illustrates how global markets tend to move more closely together during periods of financial stress, reducing the benefits of diversification.

Another example below: the correlation coefficient for a diversified portfolio versus the Morningstar U.S. Market Index.

Adjusting asset allocation periodically to maintain the desired risk level.
Suppose your portfolio is composed of 60% stocks, 35% bonds, and 5% REIT shares: a balanced mix intended to match a specific investment strategy.
After six months, the portfolio shifts due to market changes - particularly a strong performance in stocks. As a result, stocks now represent 65% of the portfolio, while bonds drop to 32% and REITs to 3%. This drift changes the risk profile of the portfolio, potentially exposing the investor to more volatility than originally planned.
To correct this, the investor performs a rebalancing by selling some stocks and using the proceeds to buy more bonds and REIT shares. This action restores the original allocation of 60% stocks, 35% bonds, and 5% REITs, aligning the portfolio back with its intended risk and return objectives.

A stop-loss and a take-profit are key levels traders set in advance to manage their positions. A stop-loss helps limit losses by triggering a sale if the price drops below a certain threshold, often when a key support level is broken. In contrast, a take-profit locks in gains by selling when the price reaches a target level, typically near a strong resistance, where the potential upside is no longer worth the risk.
3. Setting stop-loss and take-profit
Using Technical Insight, I can set a stop-loss or take-profit level on any asset.
A. Trading Central trailing stops
Trading Central trailing stops utilize a proprietary algorithm for improved position exits. These stops seek to minimize risk while maximizing profit for either long or short positions taken upon identification of a Technical Event. The algorithm is based on a statistical analysis of the historical prices, using a price filter line algorithm with two different noise statistics. As a trailing stop, the calculated stop level always follows the direction of profitable close price movement, yet will not reverse direction if close prices reverse, thereby protecting a portion of any gains made in the position. The trader has the option to control the proximity of the stop via a slider mechanism with labels "Tight", "Medium" and "Loose".
The stop level is recalculated at the end of every trading session. Intraday stop penetration alert notifications are sent where intraday price services are available and when chosen by the trader, otherwise, stop penetration alerts are calculated after session hours based on the session close price relative to the previous day's trailing stop level. Note that only one alert notification is sent, with future stop monitoring on that stock being disabled once the first notification is sent.
B. Trading Central percent trailing stops
Percent trailing stops maintain a fixed percentage offset level when prices are in the profitable direction. As a trailing stop, the calculated stop level always follows the direction of profitable close price movement, yet will not reverse direction if close prices reverse, thereby protecting a portion of any gains made in the position.
The stop level is recalculated at the end of every trading session. Intraday stop penetration alert notifications are sent where intraday price services are available and when chosen by the trader, otherwise, stop penetration alerts are calculated after session hours based on the session's close price. Note that only one alert notification is sent, with future stop monitoring on that stock being disabled once the first notification is sent.
Example:
Here, let’s suppose I want to catch the rebound after an important sell-off on Apple. I have two possibilities to manage my exit risk:
Use a trading central trailing stop:
If I want my stop to adapt dynamically to price action, I can use the Trading Central trailing stop, currently set at $160.77. It automatically adjusts as the price moves up, locking in profits while leaving room for the rebound to develop. This is especially useful in volatile situations like this, where fixed levels might be too tight and get triggered prematurely.

Set a percentage trailing stop:
Alternatively, I can use a manual stop loss based on a percentage from my entry, here 10% below the current price. Entering at $172.83, my stop would be placed around $155.18.
Using options, futures, or inverse ETFs to protect against downside risks.
How Option Insight can help you to manage your risk?
Using Option Insight: I can build a strategy, in this situation our investor is long on Tesla and wants to limit his risk. He can select among different strategies, then he will receive different outcomes with various possibilities. Option Insight helps to cover his position and therefore, manage its risk.

Asset allocation is the process of distributing investments among various asset classes based on risk tolerance and investment goals. Some common approaches include:
Conservative allocation:
A higher percentage of bonds and cash equivalents with a smaller allocation to stocks.
Example:
Balanced allocation:
A mix of stocks and bonds to maintain moderate risk and growth potential.
Example:
Aggressive allocation:
A higher proportion of stocks, including growth stocks and international equities, for greater long-term returns but with higher volatility.
Example:
Maintaining an up-to-date view of the markets is essential for effective portfolio risk management. As we saw above with the 1987 crash: volatility, sentiment shifts, or sudden changes in news flow can all impact the correlation between assets or the overall risk profile of a portfolio.
Tools like Market Buzz empower investors to track such developments in real time. For example, a sudden spike in news volume around U.S. equities might signal rising political uncertainty or unexpected announcements. These changes can influence both volatility and correlation with other markets like the Europe or emerging economies.
With Market Buzz’s sentiment analysis, investors can quickly gauge whether the overall tone of news is positive or negative. This helps in identifying whether market reactions are likely to be driven by fear, optimism, or more neutral narratives, essential information when making reallocation decisions.
Example:
Looking at Top Buzzing I can see that LEVI is among Top Buzzing ranking

If I click on the bubble and go through News Analytics, I can understand quickly why Levi Strauss is among the ranking:

Here, the overall mentions are surging, with the confirmation on the mentions' history chart. The “Most discussed topics” are “Earnings Announcement” and “Earnings above expectations” and looking quickly into the News feed an article from Reuters mentions that the company released first quarter earnings above expectations and confirmed its annual outlook.
Understanding risk and reward is fundamental to making sound investment decisions. Just like diversification relies on combining uncorrelated assets, effective portfolio management requires a combination of tools. By employing strategic asset allocation, maintaining a diversified portfolio, and using risk management techniques, investors can balance potential returns while minimizing exposure to financial downturns. The key is to align investments with individual risk tolerance, financial goals, and time horizon to achieve long-term success.


